Overview.
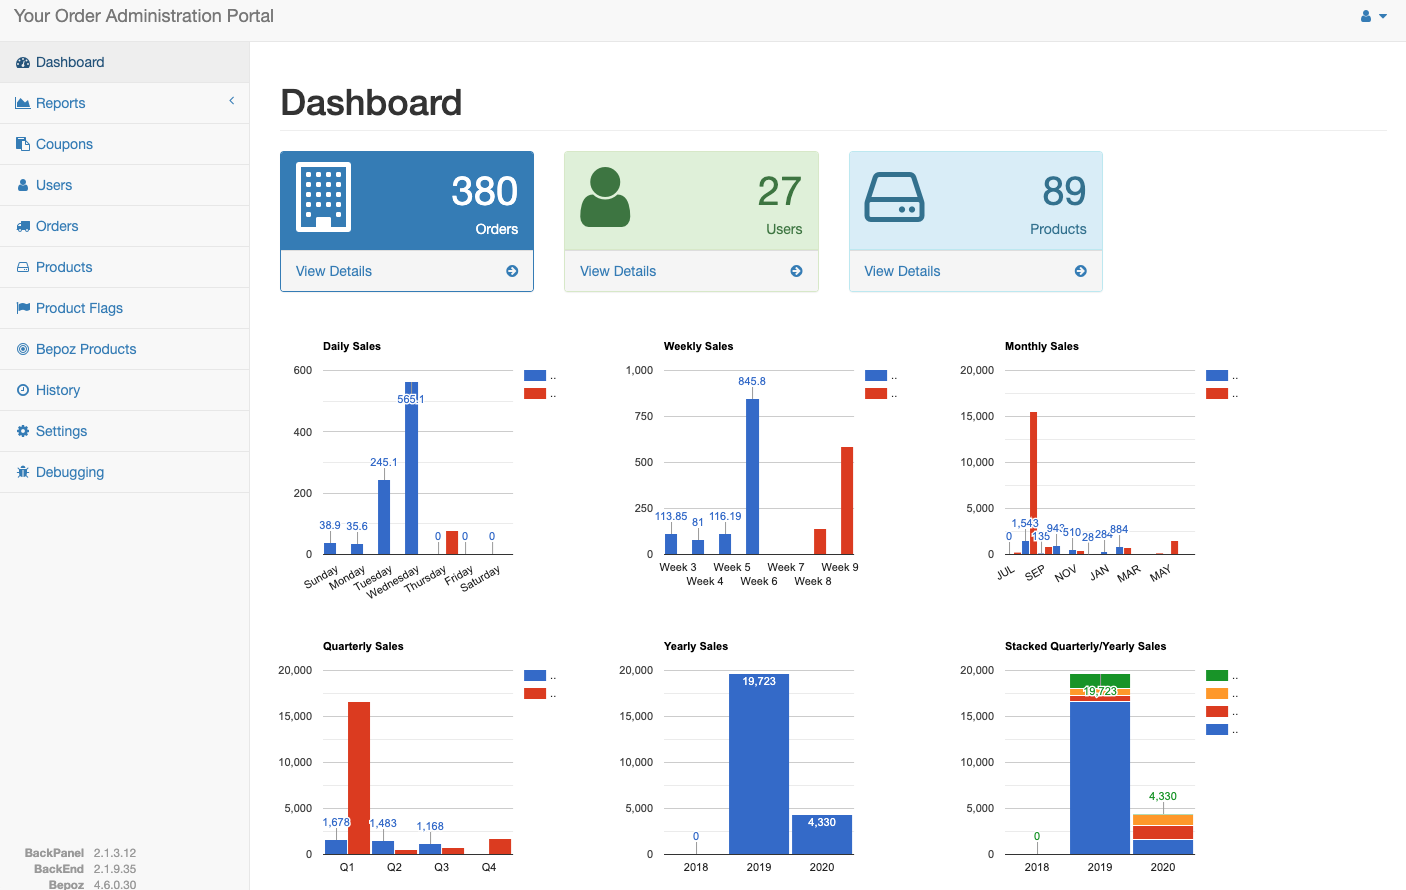
Dashboard is designed to give high-level information to operators. It also works as a shortcut to some pages, such as orders, users and products, which the user can access by clicking on “view details” on the respective pages. All charts for the existing period will be a comparison against the previous period figure.
For example, red lines in the Daily Sales chart represent Last week's sales figures, but blue lines represent the current week instead. The start month of the Monthly Quarterly and Yearly charts can be configured in the ‘Start Month of Year’ field (refer to Section 9.6 Times).
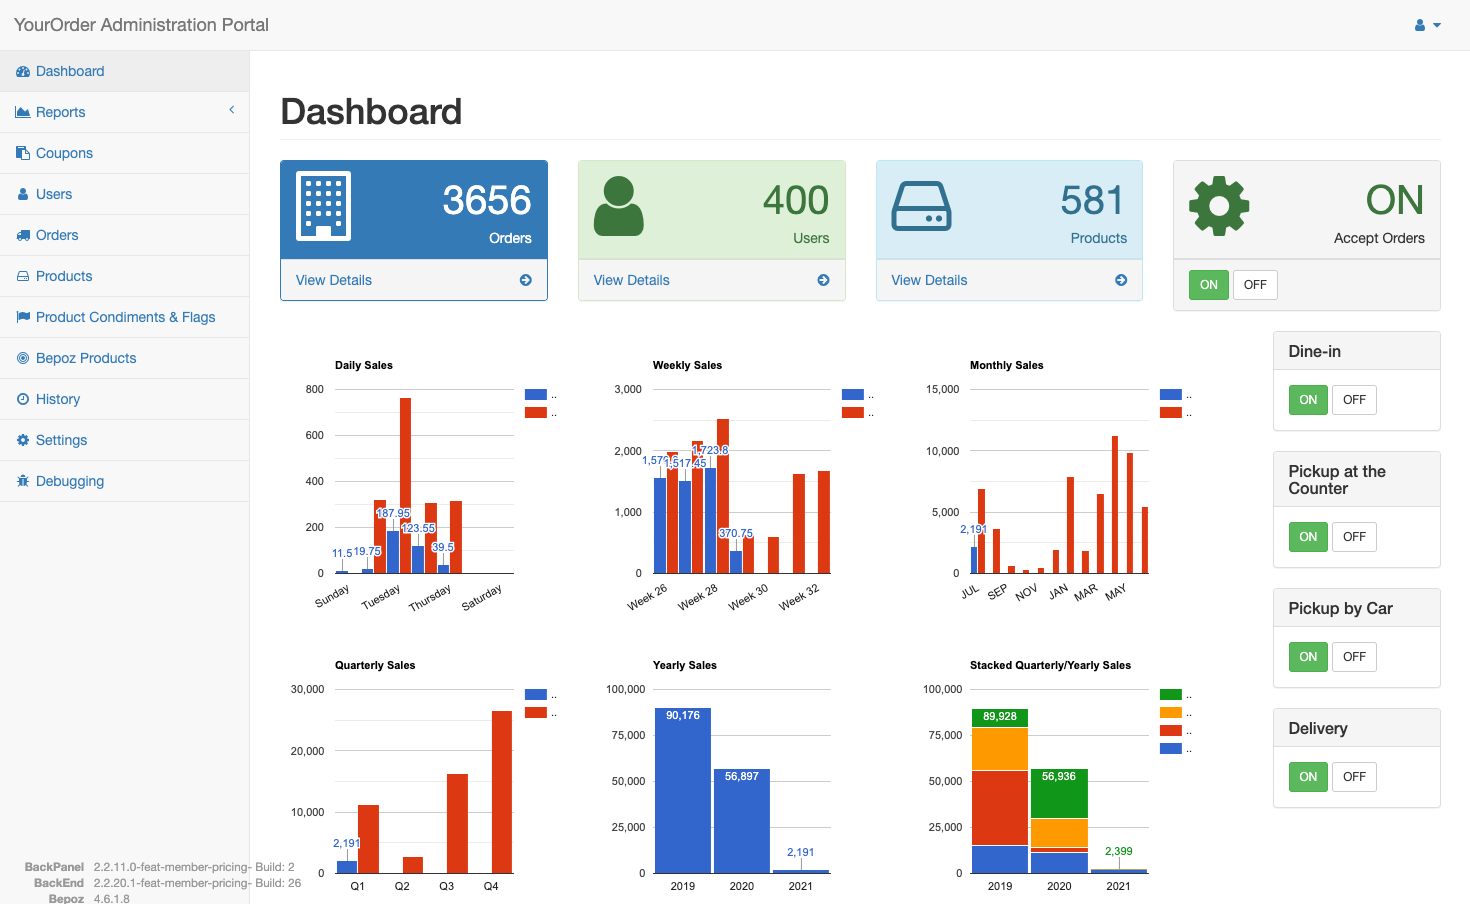
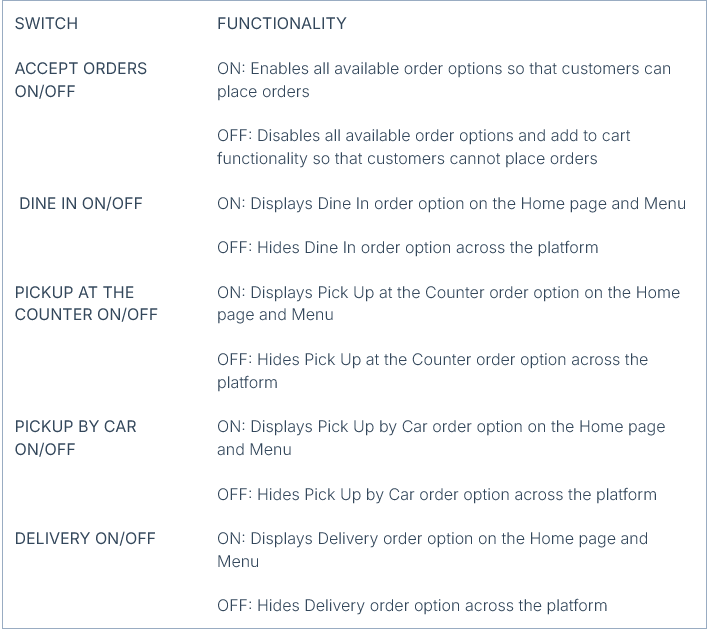
In addition, there are 5 switches available to control platform wide order options as described below.