
Overview
Dashboards show an aggregate summary of all the business Transactions for a given period of time in the format of tables, graphs, and charts.
This information is often used by businesses while analyzing the data and making decisions.
In Bepoz, Dashboards can be accessed and customized according to the convenience of the Operator so that it is easier for viewing and understanding the Business Operation.
Accessing Dashboards
- Login to BackOffice
- Click on the "Dashboards" icon from the Main Menu Bar
- It will open a Dashboard window where all the available data is displayed
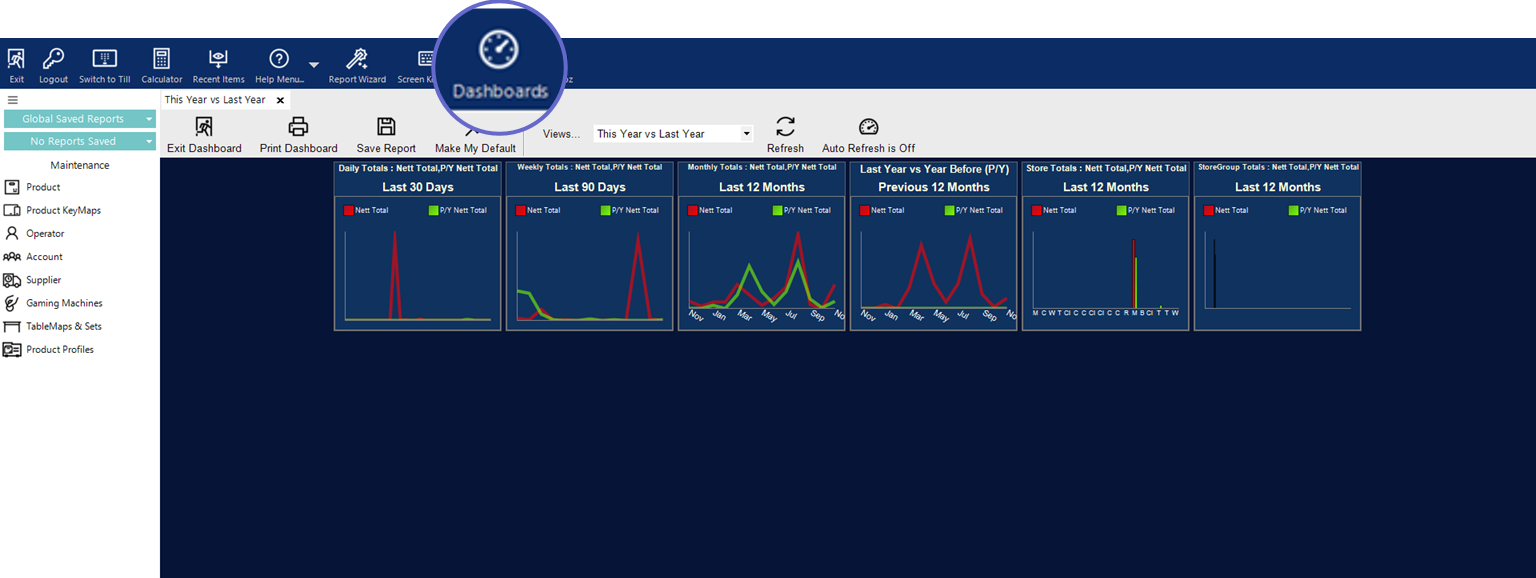
- Double-click on the Charts or Graphs to view the data in a tabular format