
Overview
This report is similar to the COGs By Stocktake Report, it takes into account Sales and Stock to calculate a true Cost of Goods and Profit.
However, in this case, there is more flexibility over the Reporting Period as opposed to Stocktakes.
Also similar to the COGs By Stocktake Report, this Report can be configured to Report on a desired Venue and Store.
Additionally, there are various flags and Product List options which can be used to control how much of the Product List will be reported on.
The Report's Standard View presents various Cost data including for Receipts, Transfers, Loss, and Sales and this View also shows Profits for the selected Period.
Prerequisites
- To access COGs features, the applicable Operator Privileges will need to be enabled
- Other Reports: "Allow Analysis Reports" flags
- Operator Maintenance 'Reporting' Tab
Accessing the Report
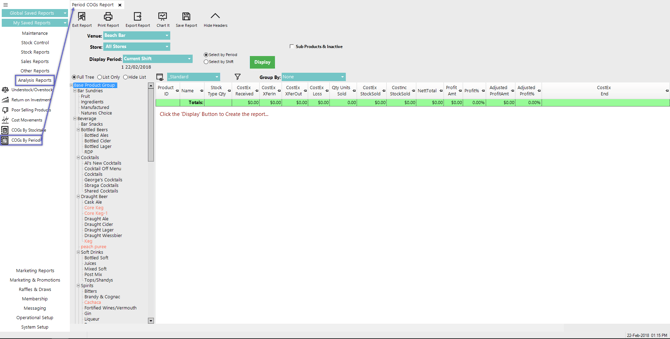
- To locate the COGs By Period Report - after logging into BackOffice, navigate to the side menu where Analysis Reports can be found
- After expanding the Analysis Reports menu, the COGs By Period Report will be available for selection
- Select the Report and once the tab opens choose the preferred Reporting Options (see below for details) and then click the Display/Refresh button to run the Report
Reporting Options
Option |
Description |
Visual/s (if applicable) |
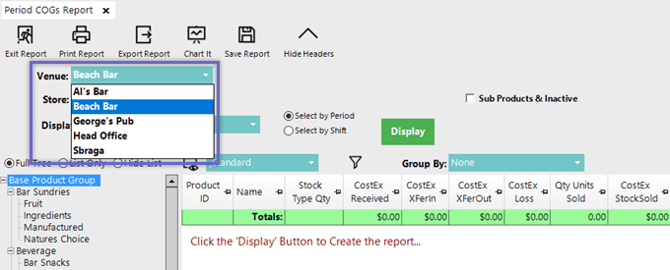
| Venue drop-down |
|
|
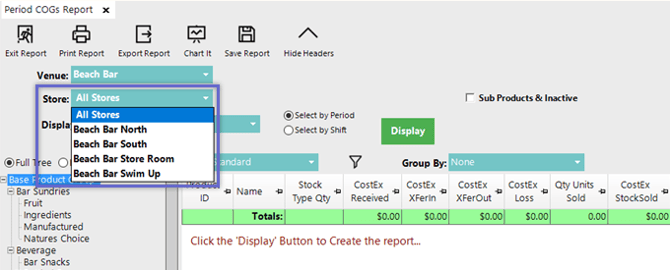
| Store drop-down |
|
|
| Sub Products & Inactive flag |
|
|
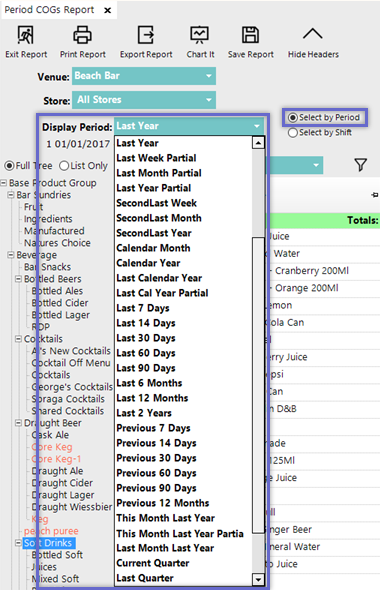
| Select by Period & Display Period |
|
|
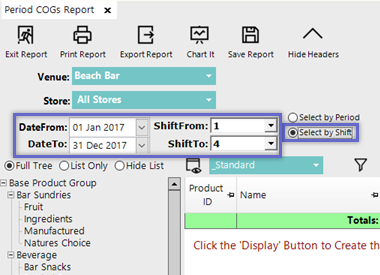
| Select by Shift |
|
|
| Full Tree radial |
|
|
| List Only radial |
|
|
| Hide List radial |
|
|
| Group By drop-down |
|
|

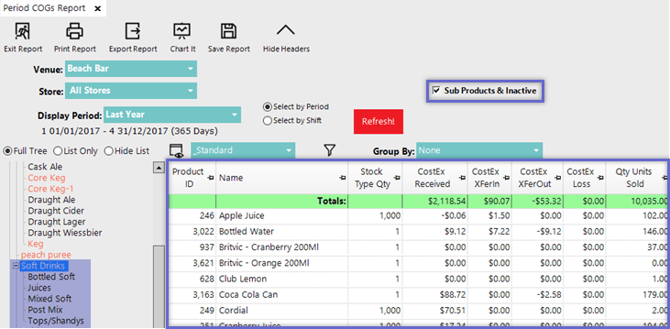

Standard View
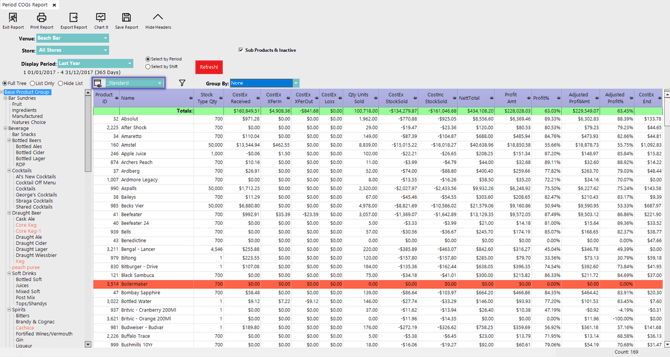
- The COGs By Period Report has a Standard View which is unique to this Report
- Alternatively, additional Views can be added by selecting the View icon and completing the standard procedure for Adding and/or Editing Views
Column Heading |
Data Description |
| Stock Type Qty |
|
| CostEx Received |
|
| CostEx XferIn |
|
| CostEx XferOut |
|
| CostEx Loss |
|
| Qty Units Sold |
|
| CostEx StockSold |
|
| NettTotal |
|
| Profit Amt |
|
| Profit % |
|
| Adjusted Profit Amt |
|
| Adjusted Profit% |
|
| CostEx End |
|