
Prerequisites
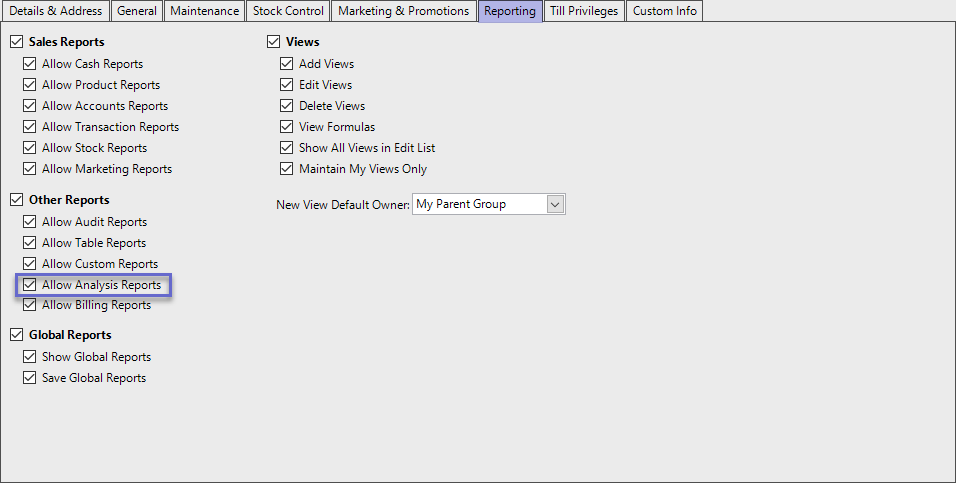
- For an Operator to be able to access and run an Analysis Report within BackOffice, the Allow Analysis Reports flag within the Reporting tab of Operator Maintenance must first be enabled
- If this flag is not enabled, an Operator cannot access ROIs, Cost Movements, and Other Reports
Accessing Cost Movements Reports
- Complete the following steps to access ROI Reports:
- Log in to BackOffice
- From the side menu, Select "Analysis Reports" to expand the list of Available Reports
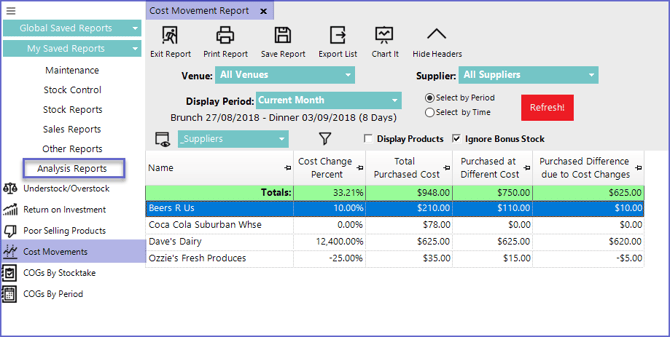
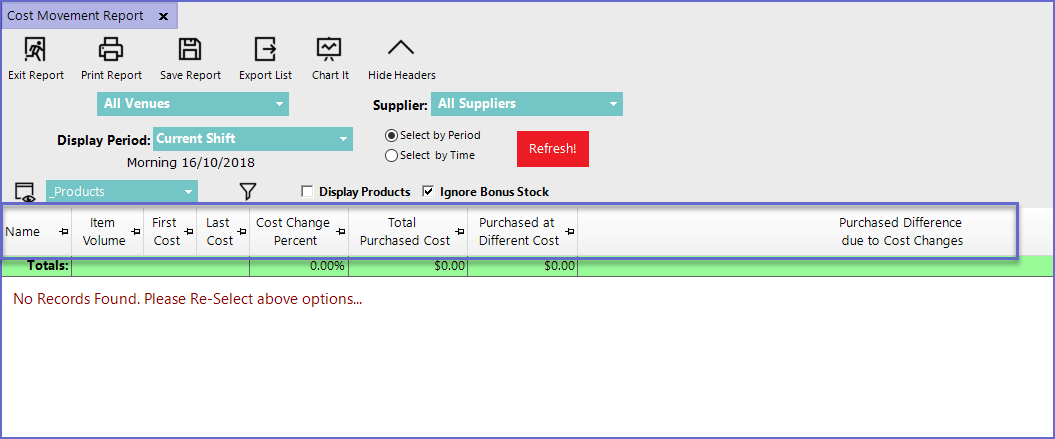
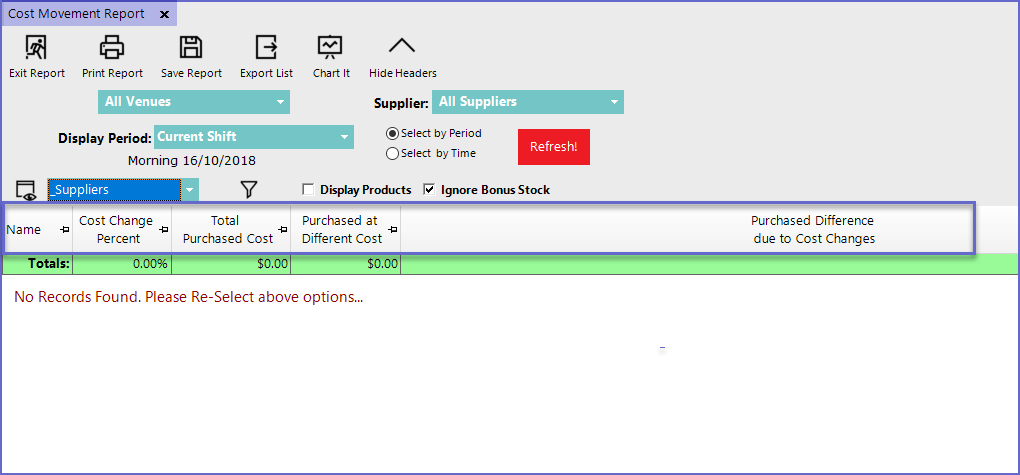
- Select Cost Movements Report which will open a new Cost Movements Window
Reporting Options
- Venue
- Sets the Venue for which the Cost Movements Report is generated
- Display Period
- Sets the time period for which report will be generated
- The time can be selected either by choosing a specific Period or by choosing a particular shift
- Sets the time period for which report will be generated
- Suppliers
- Sets a particular Supplier for the report
- Displays Products
- Will show the Products attached to the Individual Suppliers
- Ignore Bonus Stock
- Ignores the bonus stock received while calculating price change
Report View Options
"_Products" View
- The Products View of the Cost Movement Report contains the following data columns by default:
Column Heading |
Data Description/Formula |
| Item Volume |
|
| First Cost |
|
| Last Cost |
|
| Cost Change Percent |
|
| Total Purchased Cost |
|
| Purchased at Different Cost |
|
| Purchased Difference Due to Cost Changes |
|
"_Supplier" View
- The Supplier View displays all the Cost Changes made by Suppliers during the reporting period
- This report consists of the following data columns by default:
Column Heading |
Data Description/Formula |
| Cost Change Percent |
|
| Total Purchased Cost |
|
| Purchased at Different Cost |
|
| Purchased Difference Due to Cost Changes |
|